


Funsport: A Gamified Student Fitness Dashboard
During my internship, I led the design of the student dashboard that offers progress visibility and motivation to drive student fitness engagement.
Company
NetEase
Role
Product Design Intern
2 PMs (Yingchi Wang, Xiangdong Yu), 3 Dev engineers (Jeremy, David, Sue), 2 Testing Engineers (Yolande, Johnason)
Team
Time
May 2023 - Aug 2023
Students lacked clear progress insights and engaging incentives, leading to inconsistent participation and low retention.
The challenge
1. Boost Engagement & Training Participation
2. Surface & Highlight Participation
3. Deliver Clear Performance Insights
Specific goals
Key metrics
1. Weekly Active Users (WAU) (Target: +20% DAU MoM)
2. Badge Acquisition Rate (Target: ≥ 1badges/month)
3. Score Improvement Rate (Target: ≥ 10% improvement)
User Discovery
I start by reviewing field interview notes and validating with PM and pain points of progress visibility and incentives, and generate a few insights:
students were incentivized by school leaderboards and reward stickers
students don’t have personalized training guidance
schools hope to increase participation and grades

Competitive Analysis
I conducted competitive analysis on several popular learning/fitness apps with strong student user base, and pulled several design insights:
break large goals into smaller milestones and components
award badges of different visual themes
set up challenges and goals to incentivize actions

Hypothesis and Concept
Based on my discovery, I came up with an initial wireframes that has a badge reward system with challenges, and a performance analysis section to offer insights on scores and personal training recommendations.

Designing for Engagement Metric
I compared with the PM about different reward structure designs. We landed on the option that emphasizes bite-sized tasks prompting easy action under a goal, and most likely to push engagement growth.

The reward structure design with monthly badges and bite sized tasks drove an 22% increase in monthly active participation rates.

Fitting Design into School Contexts
The badge system needed to be compatible with how the students train in school calendars, meaning they train on weekdays at school, in semester based 3-4 academic years. Accordingly, the reward design needs to fit this time frame, as well as sustaining for years.

The travel-themed based reward system sets a goal every month in a country with city badges, and the country refreshes every month. This design ensures they fit into the academic calendar, as well as making the collection process fun for students, achieving 83% students collecting at least 1 badge per month.

Highlighting Analytics by User Feedback
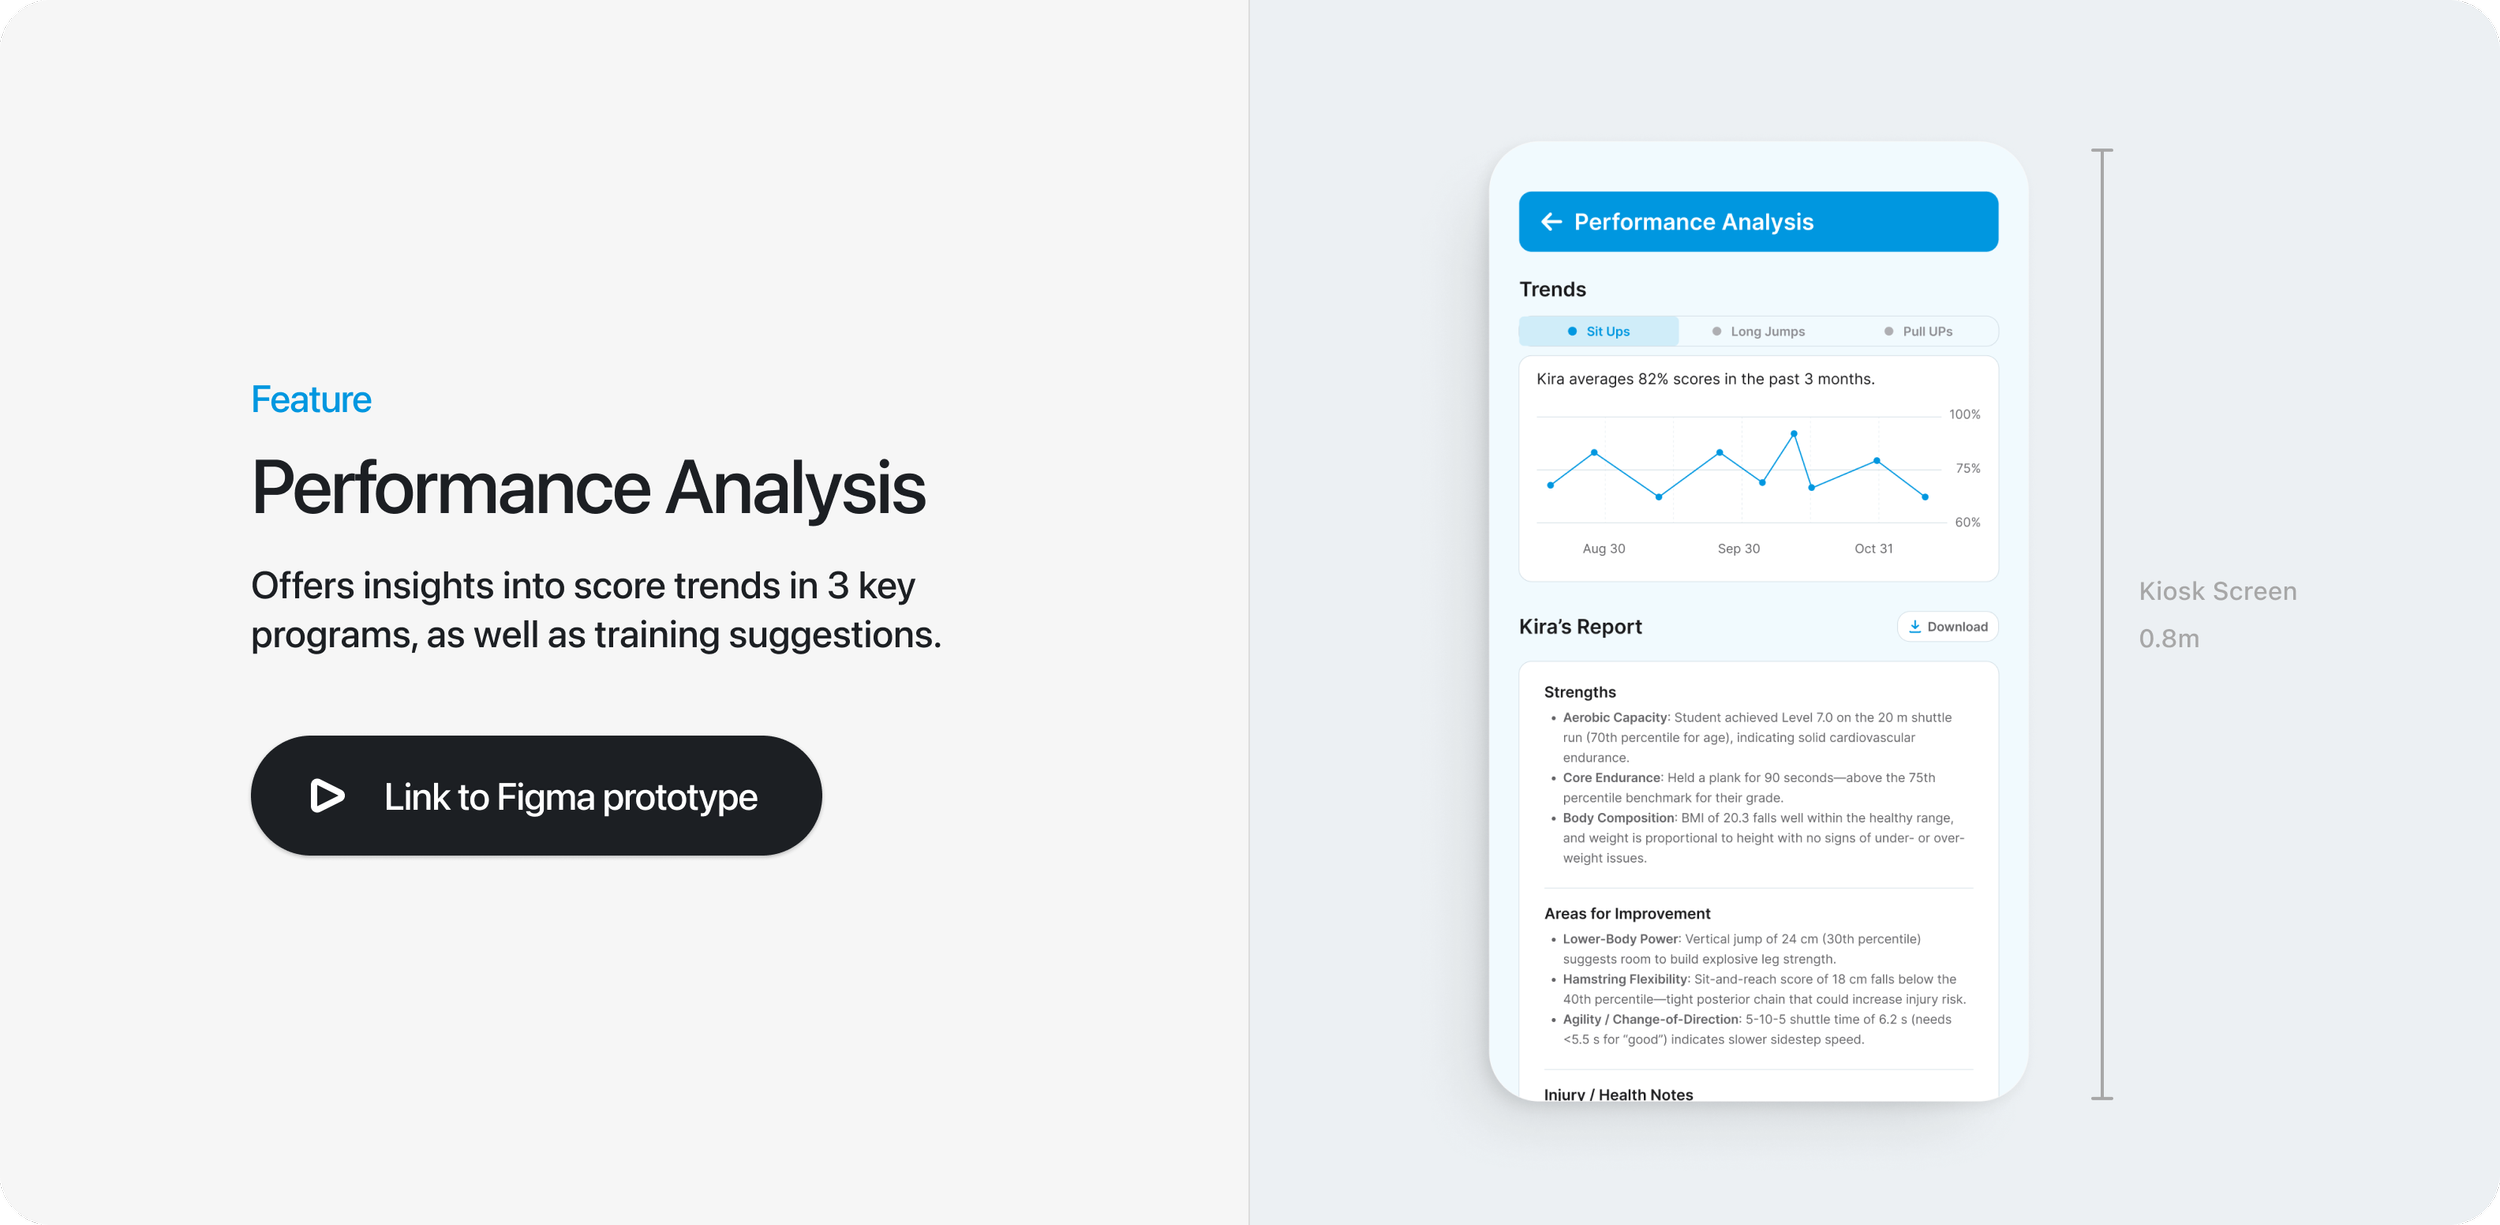
I gathered user thoughts on what would be most helpful to see for scores improvement, and explored several design options highlighting different information category. Combining with system power, I landed on the design that highlights 3 key program score trends, as well as training recommendations.

The performance analysis screen offers insights into program score trends in the last 3 months, as well as a personalized training report highlighting strengths and improvement practices. Data shows 82% students interacting with this panel on a weekly basis improved in performance by 7%.
Customer Reviews
92%+ Positively Reviewed


Significant engagement growth as well as improvement in student grades.
Results
Keep reading
My other projects

Clinical Voice AI

AI Chat Architecture

Travel Onboarding & Search